一、xdebug 工作原理
引用 xdebug 的文档:Communication Set-up
当远程调试时,xdebug 充当着客户端的角色,而 IDE 像是服务器,它会侦听调试端口,就是默认的9000,等待 xdebug 建立远程调试的连接。如下图所求:

- The IP of the server is 10.0.1.2 with HTTP on port 80
- The IDE is on IP 10.0.1.42, so xdebug.remote_host is set to 10.0.1.42
- The IDE listens on port 9000, so xdebug.remote_port is set to 9000
- The HTTP request is started on the machine running the IDE
- Xdebug connects to 10.0.1.42:9000
- Debugging runs, HTTP Response provided
当使用匿名IP时,是通过配置 xdebug.remote_connect_back,工作流程像下图所求:
- The IP of the server is 10.0.1.2 with HTTP on port 80
- The IDE is on an unknown IP, so xdebug.remote_connect_back is set to 1
- The IDE listens on port 9000, so xdebug.remote_port is set to 9000
- The HTTP request is made, Xdebug detects the IP addres from the HTTP headers
- Xdebug connects to the detected IP (10.0.1.42) on port 9000
- Debugging runs, HTTP Response provided
当有了侦听端口的机制,那他们是如何配合起来工作的呢?
HTTP Debug Sessions
Xdebug 是依靠 cookies 来跟踪来自浏览器的请求. 工作流程是这样:
- 使用GET或POST的请求参数:
XDEBUG_SESSION_START=name, 当有请求参数时会忽略XDEBUG_SESSIONcookies 的值。 - 设置请求的cookies值
XDEBUG_SESSION
当xdebug检测到 XDEBUG_SESSION_START 或 XDEBUG_SESSION时,会尝试连接调用的客户端
当xdebug检测到 XDEBUG_SESSION_STOP 时,会终止调试。
二、配置 xdebug
首先安装 xdebug 模块
1 | sudo pecl install xdebug |
配置 php.ini:
1 | [xdebug] |
更多配置参数请查看:XDebug 参数列表
如何知道配置成功了?
通过 phpinfo(),如何看到启动的模块中包含 xdebug 信息,且配置如上面所示,则表示成功了。
四、配置IDE
这里使用 phpstrom。
配置 phpstorm 的侦听端口:
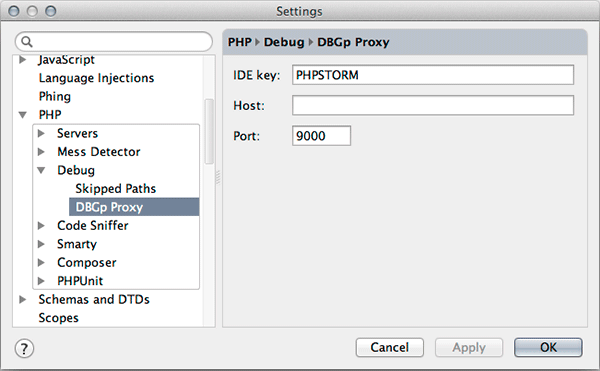
启动侦听端口
(可选)安装浏览器插件,设置idekey
如果你使用不同的IDE调试,每个IDE的key是不一样的,你可以通过安装浏览器插件,让它配置key并插入cookies,比如chrome插件xdebug helper
如何知道IDE配置成功了?
通过 terminal,执行 sudo lsof -n -i4TCP:9001 | grep LISTEN,如果看到IDE在侦听该端口,则表示成功了。
五、开始调试
设置断点,然后浏览器打开要调试的url。